How to Analyze Any Amazon Product in 5 Minutes
Revenue estimates, margin breakdowns, sales trends, price history — learn how to read every signal in a product detail panel and make faster, smarter sourcing decisions.

Most Amazon sellers spend days evaluating a single product. They open spreadsheets, manually check Keepa, guess at FBA fees, and still end up uncertain. The problem is not a lack of data — it is knowing which data matters, in what order, and what each number actually means.
This guide walks through a complete product analysis using AMZDataLens, covering every tab in the product detail panel: Overview, Sales Estimator, Price, BSR, and Reviews. By the end, you will know exactly what to look for and how to reach a sourcing decision in under five minutes.
Step 1 — Find your product
Start in Product Research. Search by keyword, brand, or paste an ASIN directly. Results load in a grid view showing each product's price, BSR, rating, and review count. When you see something worth investigating, click Analyze.

Use the marketplace selector to switch between US, UK, DE, and other supported markets. The same ASIN often performs very differently across marketplaces — always check your target market directly.
Step 2 — Read the Overview tab (30 seconds)
The Overview tab is your first filter. Four metrics at the top tell you immediately whether a product is worth deeper analysis.
- Monthly Sales — units sold per month estimated from BSR. For the Nike Air Monarch IV in the example: 1.6K units/month
- Monthly Revenue — gross revenue estimate based on current price × units. Here: $137K/month
- Annual Projection — monthly revenue × 12. Here: $1.6M — useful for sizing the opportunity
- BSR Drops (30D) — how many times the BSR dropped in the last 30 days, a proxy for actual sales events. Here: 42 drops, confirming consistent daily sales

Scroll down and you will find three more panels that complete the picture:
- BSR & Price — current BSR (#1,299), 30-day and 90-day BSR averages, and price trend. Here: price is UP +16.7% trend, which means the seller is raising prices as demand holds
- Margin Analysis — the most important panel for sourcing decisions. Sale price $85.00, referral fee −$14.45, FBA fee −$8.16, net to Amazon $62.39, gross margin 73.4%, monthly net revenue $18.7K, annual net $224.6K
- Sellers & Competition — active seller count (1), FBA/FBM split, competition level (HIGH), and whether Amazon itself is listed on the ASIN
A gross margin of 73.4% looks excellent — but this is Amazon's net after fees, not your net after cost of goods. You must subtract your landed COGS from the $62.39 net figure to get your actual profit per unit. Always work from net, never gross.
Step 3 — Validate with the Sales Estimator tab (60 seconds)
The Overview revenue figure is a point-in-time estimate. The Sales Estimator tab shows you the full 12-month trend — which tells you whether the product is growing, stable, or declining.
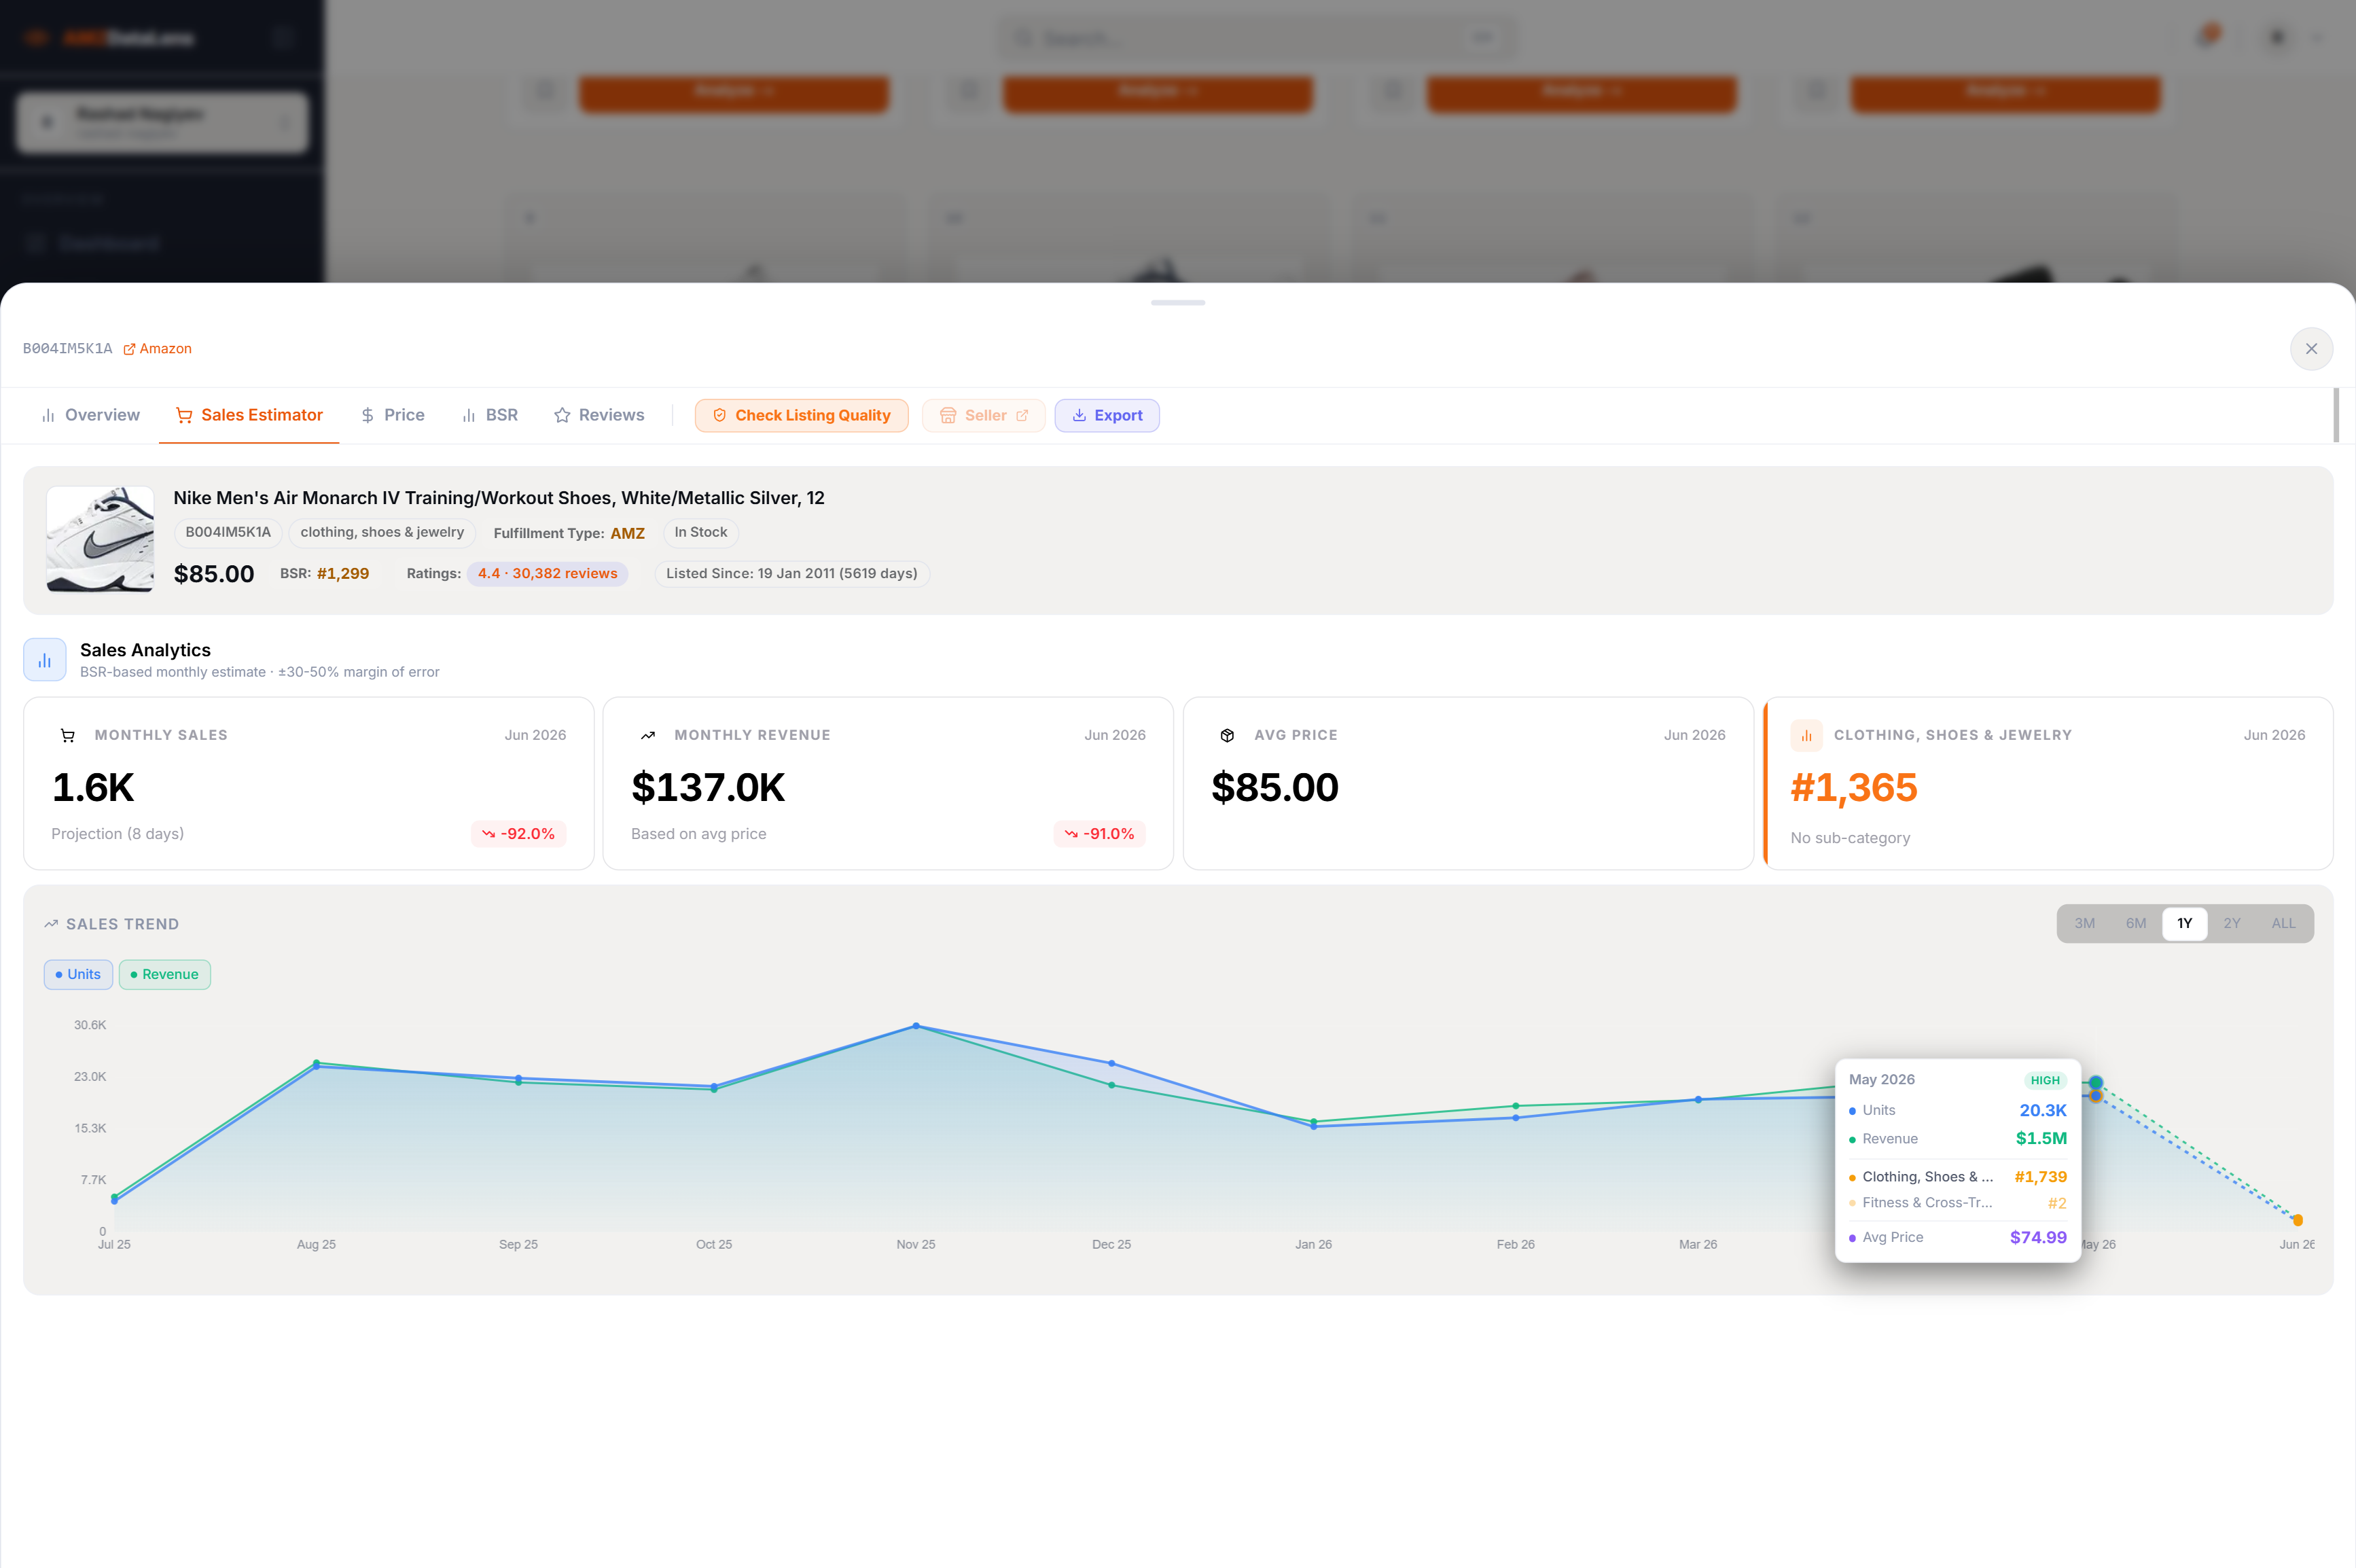
What to look for in the sales trend chart:
- Consistent flat-to-rising trend — ideal. Demand is stable or growing without artificial spikes
- Sharp peak followed by drop — usually seasonal or a promotional event. Verify with BSR history before drawing conclusions
- Gradual long-term decline — avoid unless you have a clear differentiation plan that addresses why buyers are moving away
- Volatile spikes with no pattern — can indicate a product being gamed with fake orders or review manipulation
The Sales Estimator uses a BSR-based model with a ±30–50% margin of error. Treat it as a directional signal, not an exact forecast. A product showing $137K/month could realistically be anywhere from $70K to $200K. What matters is the trend shape, not the precise number.
Step 4 — Check the Price tab (60 seconds)
Price history tells you two things: how stable the market is, and whether the current price is an anomaly or the norm.

Key metrics on the Price tab:
- Buy Box price — what customers actually pay. Currently $85.00, up +6.3%
- Avg (Period) — the average price over the selected period. Here: $69.01 over all time, $71.78 over 30 days. The current $85.00 is significantly above the long-run average — check if this is a recent trend or a temporary spike
- Period Low / High — $59.50 to $85.00 range. A $25.50 spread (35.3%) classified as Volatile means this product's price moves significantly, which complicates margin planning
- Seller count overlay — when the seller count drops to 1 and the price jumps, it usually means a single seller controls the Buy Box and has raised prices during a stockout period
If you see price volatility above 25%, check the seller count at the same time periods. Volatility caused by stockouts (seller count dropping to 1) is actually an opportunity — it means demand exceeds supply regularly, and a reliable in-stock seller can capture that premium.
Step 5 — Cross-reference BSR and Reviews
The final two tabs — BSR history and Reviews — are your confirmation layer. They validate whether the sales and revenue signals you have seen are genuine.
In the BSR tab, look for a smooth downward trend (improving rank) over the 6–12 month range. Sudden sharp drops followed by recovery are normal sales spikes. A product that has held a BSR under 2,000 in Clothing, Shoes & Jewelry for 12 consecutive months is a proven, demand-stable product.
In the Reviews tab, a healthy growth curve should show steady cumulative growth over months and years — not sudden vertical jumps. A spike of thousands of reviews in a single month is a manipulation signal and a risk flag for the entire niche.
The 5-minute decision framework
Put it all together and you have a repeatable framework:
- Overview (30s) — Is monthly revenue in your target range? Is gross margin above 60%? Is competition level manageable?
- Sales Estimator (60s) — Is the 12-month trend stable or growing? No suspicious spikes?
- Price (60s) — Is volatility below 25%? Is the current price near the 30-day average (not an anomaly)?
- BSR (60s) — Is the BSR trend consistently improving over 90+ days?
- Reviews (30s) — Is review growth organic (no sudden spikes)? Is the review count low enough to compete?
If all five checks pass, add the product to Saved Items and export the full data for your sourcing comparison sheet. If any one check raises a red flag, dig deeper before committing — most red flags have an explanation, and understanding them sharpens your niche read.
Product research is not about finding a perfect product. It is about finding a product where the data tells a consistent story — demand is real, competition is manageable, margin is sustainable, and the trend is in your favour. AMZDataLens gives you every data point you need to read that story, in one panel, in under five minutes.
Tags