From Filter to Product: A Real Product Finder Walkthrough
A complete, step-by-step walkthrough of a real Product Finder session — from setting filters to analyzing a candidate product. Using real data from the shaker bottle niche.

Reading about filters is one thing. Watching them work on real data is another. This walkthrough takes you through a complete Product Finder session from start to finish — setting the initial filters, reading the results grid, selecting a candidate, and running the full product analysis. Every number in this guide comes from real AMZDataLens data.
The niche: shaker bottles and kitchen dispensers. The target: a product with proven demand, manageable competition, and room for a new entrant. Here is exactly what the data shows.
Step 1 — Setting the initial filters
The session starts in Product Finder with the US marketplace selected. Rather than searching a keyword, we build a filter stack designed to surface products with real sales velocity and a low-to-medium review barrier.

The two active filters for this session:
- Best Sellers Rank: Min rank 15,000 — every result has genuine, consistent sales. Products beyond BSR 15,000 in Kitchen & Dining tend to have sporadic, unreliable velocity
- Title Keywords: 'Shaker bottles' — finds every product whose Amazon listing title contains this phrase, regardless of which sub-category it sits in. This is broader than a keyword search — it includes products Amazon might not surface for this term organically
Notice what is not set: no review count filter, no price filter, no category filter. The first pass is intentionally broad. The goal is to see the full landscape of what qualifies before narrowing. Adding too many filters upfront risks hiding the most interesting results.
Step 2 — Reading the results grid
The search returns a grid of products matching the filter criteria. Each card shows the essential metrics: product title, ASIN, BSR in category, price, rating, review count, monthly units sold, and fulfillment type.

Scanning the grid, one product stands out immediately: the LITALAR Pancake Batter Dispenser Bottle Kit. Here is why it catches the eye:
- BSR #12,967 in Kitchen & Dining — solid sales velocity in a massive category
- Only 159 reviews with 4.3 stars — extremely low review barrier for the sales volume it is generating
- Price $11.99 — accessible price point, high purchase frequency likely
- Amazon badge: '600+ purchases/month' — Amazon's own social proof badge, which only appears when purchase frequency is high and sustained
- Listed since October 22, 2025 — only 230 days old. A product this new with this many sales and this few reviews is a classic fast-growing opportunity
- FBA fulfillment — eligible for Prime, level playing field on logistics
The 600+ purchases/month badge is one of the most reliable demand signals on Amazon. It is calculated by Amazon from actual checkout data — not an estimate. A 230-day-old product earning this badge has proven it can sustain significant purchase volume, not just spike once.
Step 3 — Overview analysis
Clicking Analyze opens the full product panel. The Overview tab loads first with the top-line metrics.
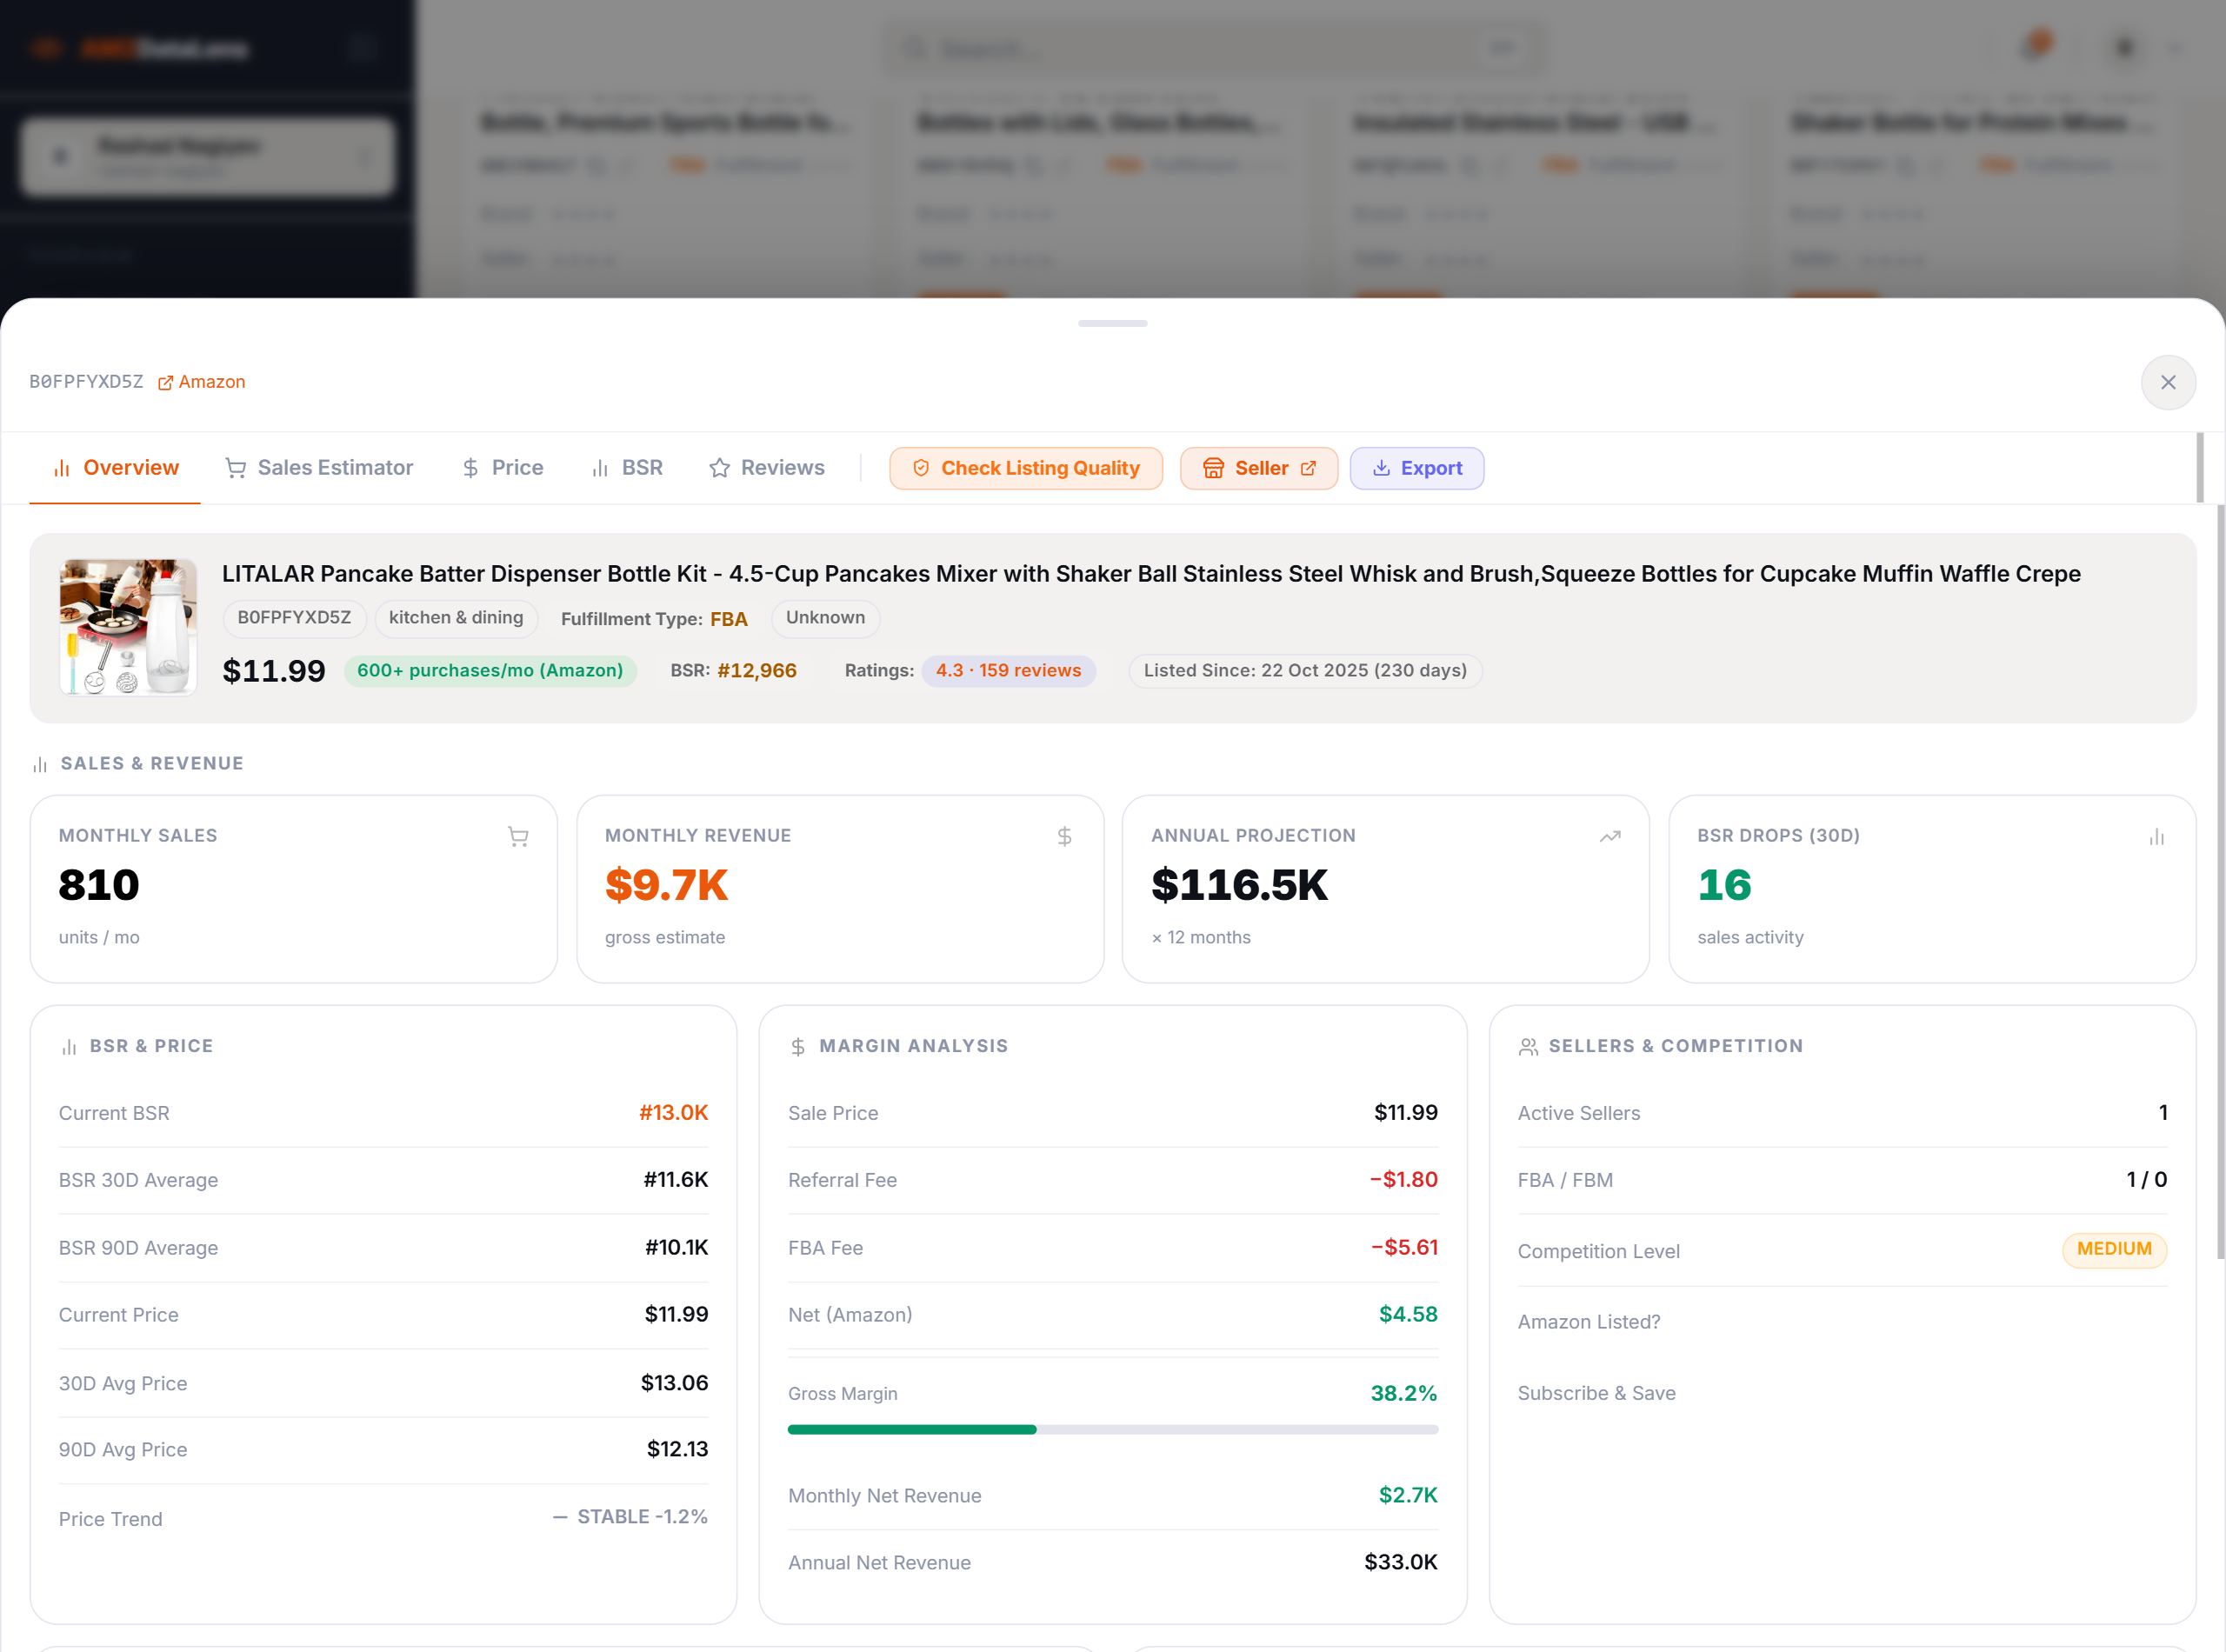
Reading the key numbers:
- Monthly Sales: 810 units — confirms the 600+ badge. Real, consistent demand
- Monthly Revenue: $9.7K — modest for a $11.99 product, but at 810 units/month this is a high-velocity item
- Annual Projection: $116.5K — the total market size estimate for this ASIN. At 810 units, there is room for multiple sellers to coexist
- BSR Drops (30D): 16 — only 16 BSR drops in 30 days seems low for 810 monthly sales. This signals the product likely has multiple variations sharing a parent ASIN, and BSR reflects the parent while unit sales reflect the specific variant
- Gross Margin: 38.2% — after Amazon fees, 38.2% remains. This is the Amazon net, not your profit. You still need to subtract landed COGS
- Net to Amazon: $4.58 per unit — after referral fee ($1.80) and FBA fee ($5.61), $4.58 reaches your account per unit sold. On 810 units/month that is $3,710/month gross before COGS
- Competition Level: MEDIUM — not too crowded, not a wide-open niche. Active sellers: 1 — currently only one seller on the listing, which means full Buy Box ownership and zero price competition
The $4.58 net per unit is before your cost of goods. At $11.99 selling price with $7.41 in fees, your maximum COGS to maintain a 30% net margin is approximately $1.55 per unit landed. This is a tight margin product — the opportunity is in volume, not margin. Ensure your sourcing cost supports this before committing.
Step 4 — Sales trend validation
The Sales Estimator tab shows the 12-month trend. This is where we validate whether the strong current metrics represent a sustainable pattern or a temporary peak.

What the trend chart reveals:
- Consistent growth from launch (Oct 2025) to peak (May 2026) — 7 months of uninterrupted growth is a very strong signal. This is not a spike, it is a trend
- Peak of 1,700 units in May 2026 — the current 810 estimate is the June projection, likely conservative. The actual May performance was double the current estimate
- BSR in Kitchen & Dining: #10,178 at peak, sub-category Batter Dispensers: #10 — at peak this product was the 10th best-selling batter dispenser on Amazon. That is a real market position
- Average price at peak: $13.99 — higher than the current $11.99. The price has since dropped, possibly due to increased competition or a promotional period
Step 5 — Price history check
The Price tab confirms something important about this product's competitive history.

The price history changes the picture significantly:
- Launch price was $29.99 — the product launched at nearly triple the current price. This means the original margins were very healthy; the current $11.99 represents significant price erosion
- Price volatility: 85.8% — this is extremely volatile. The spread from $11.99 to $29.99 represents an $18 range on a product that now sells for $11.99
- Period average: $15.74 — even the average is 31% higher than current price. This confirms the current $11.99 is at the low end of the historical range
- Seller count currently 1 — at $11.99, there is only one active seller. This could mean either the price has compressed to the point where most competitors have exited, or this is a temporary low driven by a promotional strategy
The 85.8% price volatility combined with a launch-to-current price drop of 60% is a significant red flag. This product has experienced severe price compression. Before sourcing, you must determine: is the current $11.99 a temporary low or the new normal? Check if the downward price trend has stabilised over the last 60–90 days, or if it is still falling.
Step 6 — BSR and review check
The BSR tab shows the Kitchen & Dining rank trend over the past year, which confirms the growth pattern seen in sales. The BSR improved (fell) from 18,000+ at launch to a low of around 5,000 at peak, then stabilised in the 10,000–13,000 range.

The Reviews tab shows 159 reviews accumulated since October 2025 — a +1,123% growth rate from the initial 13 reviews. The growth curve is smooth and organic with no manipulation spikes, and the rating holds steady at 4.3 stars. This is exactly what healthy review growth looks like for a new product.

The verdict — what the data tells us
After running through all five tabs, here is the honest assessment of this product as a sourcing opportunity:
- Genuine demand confirmed — 810 units/month, 600+ purchases badge, consistent 7-month growth trend. The demand is real
- Extremely low review barrier — 159 reviews after 230 days means a new entrant could reach parity within 3–4 months at similar sales velocity
- Tight margins at current price — $4.58 net per unit at $11.99 leaves very little room for COGS. This product only works economically if landed cost is under $2
- Price compression is a serious concern — 60% drop from launch price to current suggests the niche is commoditising. The original opportunity (at $25–$30) was much stronger than the current one (at $11.99)
- Strong as a differentiation play — the real opportunity here is not copying this exact product at $11.99, but entering with a differentiated version (premium materials, bundle, additional functionality) that can command $18–$25 and restore the margin
- Sub-category #13 confirms real market — Batter Dispensers is a real, active sub-category with meaningful sales. The niche exists and has buyers
This walkthrough demonstrates the most important Product Finder insight: a product can simultaneously be a poor direct-copy opportunity and an excellent differentiation opportunity. The data does not tell you to copy this product — it tells you this niche has real demand, a low review barrier, and a price gap between the current commodity level ($11.99) and the original premium level ($29.99) where a genuinely better product could comfortably live.
Product Finder does not make the sourcing decision for you. It surfaces the candidates and gives you the data to evaluate them. The decision — and the differentiation strategy — is yours. But without the data, you would be making that decision blind. With it, you can see exactly what the opportunity is, what the risks are, and where the real upside lies.
Tags